
Heatmaps in Trading: The Complete Guide to Visualising Market Depth
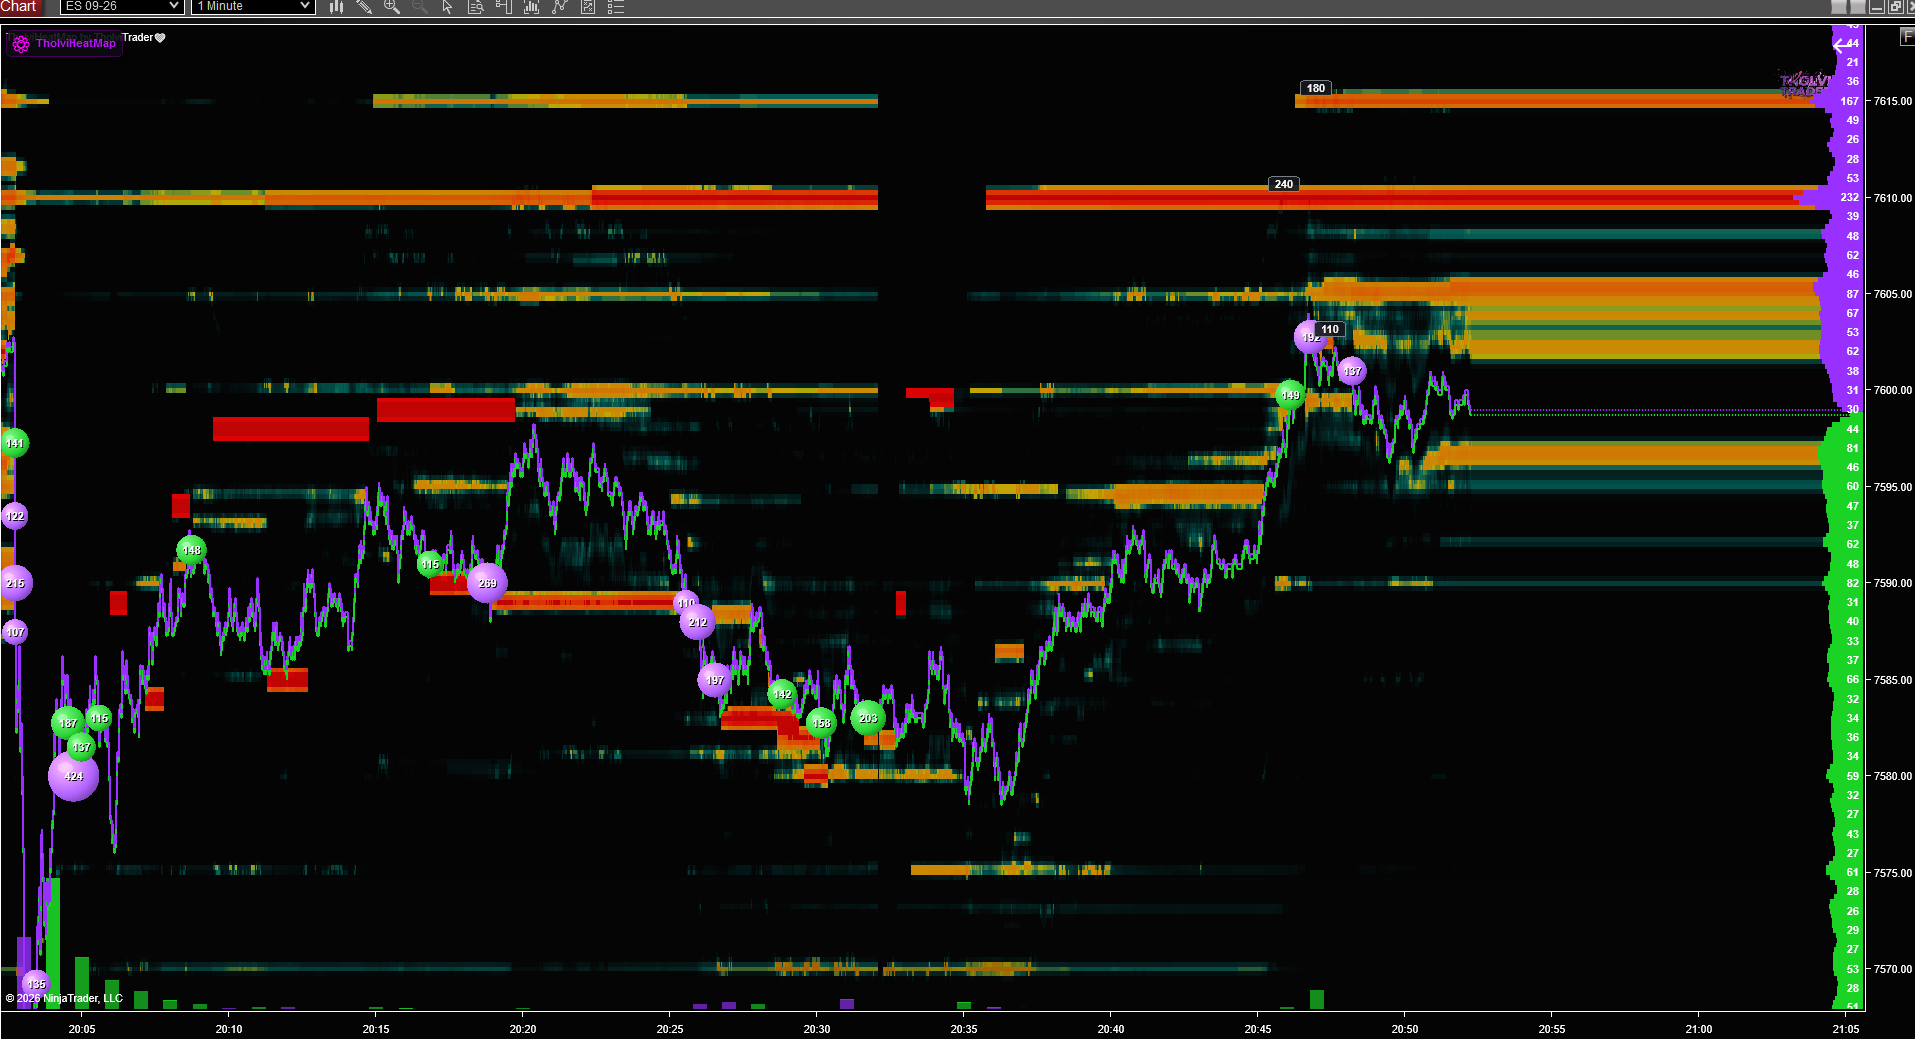
Table of Contents
1. The Evolution of Market Analysis
2. Defining the Trading Heatmap
3. Understanding the Limit Order Book
4. Interpreting Color Intensity and Liquidity
5. Identifying Institutional Footprints
6. Spotting Spoofing and Layering Patterns
7. Integrating Heatmaps into a Trading Strategy
8. Advanced Order Flow Techniques
9. Common Pitfalls to Avoid
10. Mastering the Art of Visual Order Flow
The landscape of financial markets has undergone a radical transformation over the last three decades. We have moved from the chaotic shouting matches of open outcry pits to the silent, lightning fast world of electronic matching engines. In this high speed environment, traditional tools like candlesticks and moving averages often fall short because they only tell you where the price has been, not where it is likely to go. This lag is the primary reason why professional day traders have shifted their focus toward market depth and order flow.
Visualising market data is no longer just about looking at a two dimensional price chart. It is about understanding the intentions of market participants before a trade even occurs. This is where the concept of heatmaps enters the frame. By translating the complex, fast moving data of the Limit Order Book into a visual spectrum of colors, traders can finally see the invisible walls of supply and demand that govern price movement.
In the early days of trading, experts relied on tape reading. This involved scanning a continuous stream of prices and volumes to sense market momentum. While effective for some, it required an immense amount of mental processing power. The modern heatmap is essentially the digital evolution of tape reading. It takes the raw data from the Level 2 montage and plots it historically, allowing the human eye to recognize patterns that would be impossible to catch in a scrolling list of numbers.
A trading heatmap is a graphical representation of the Limit Order Book over time. While a standard price chart shows the result of executed trades, a heatmap shows the intentions of traders who have placed orders but are waiting for the market to reach them. This distinction is crucial because it reveals the liquidity landscape of a specific asset.
The primary target keyword, Heatmaps in Trading, is often associated with advanced platforms like Bookmap which specialize in this type of visualization. These tools allow users to see exactly where large buy and sell orders are sitting in the market. By using a color scale, typically ranging from cool blues to hot reds or oranges, the heatmap highlights areas with high concentrations of limit orders.
1. The Vertical Axis: This represents the price of the asset, similar to a traditional chart.
2. The Horizontal Axis: This represents time, moving from left to right.
3. The Color Gradient: This is the most important element. It represents the volume of limit orders at a specific price level. Darker or more intense colors signify higher liquidity.
4. The Price Line: A real time line that tracks the current market price as it moves through the liquidity zones.
To master heatmaps, one must first understand the Limit Order Book or LOB. The LOB is a record of all outstanding limit orders for a financial instrument. A limit order is an instruction to buy or sell a specific amount of an asset at a specific price or better. Unlike market orders, which execute immediately at the best available price, limit orders provide liquidity to the market and wait to be filled.
When you look at a heatmap, you are essentially looking at the history of the LOB. You can see how liquidity enters the market, how it shifts as price approaches, and how it disappears when orders are either filled or canceled. This provides a transparent view of the auction process.
Most of the liquidity seen on a heatmap is provided by market makers and institutional players. These entities use sophisticated algorithms to place thousands of orders across various price levels. Their goal is to profit from the bid ask spread or to facilitate large trades for clients. By observing how these large players position themselves, retail traders can gain insights into where the market might find support or resistance.
The power of the heatmap lies in its ability to show the strength of a price level at a glance. When a specific price area glows with intense color, it indicates a high volume of limit orders. This is often referred to as a liquidity pocket.
In traditional technical analysis, support and resistance are drawn based on historical price touches. In the world of heatmaps, these levels are visible in real time before price even arrives.
1. High Liquidity Zones: When price approaches a zone with deep, intense color, it often struggles to break through. This is because there are thousands of contracts or shares waiting to be filled, acting as a physical barrier.
2. Low Liquidity Holes: Conversely, areas with very little color intensity represent liquidity gaps. If price enters these zones, it tends to move very quickly because there is little resting interest to slow it down.
One of the greatest advantages of using a tool like Bookmap is the ability to distinguish between retail noise and institutional activity. Large institutions rarely move their entire position at once. Instead, they layer their orders or use iceberg orders to hide their true intentions.
When you see a thick, persistent line of high liquidity that stays at a certain price level despite market volatility, you are likely looking at an institutional buyer or seller. These players have the capital to defend a price level. If the market approaches such a level and the liquidity remains firm, it is a strong signal that the level will hold. However, if the liquidity suddenly vanishes as price touches it, this is a sign of manipulation or a change in sentiment.
Market manipulation is a reality of electronic trading, and heatmaps are the best way to detect it. Spoofing is a practice where a trader places a large limit order with no intention of executing it. The goal is to create a false impression of supply or demand, tricking other traders into moving the price in a specific direction.
1. The Approach: Price begins to move toward a large block of liquidity.
2. The Disappearance: Just before price reaches the level, the large order is canceled and immediately reappears on the opposite side of the market.
3. The Reaction: The sudden lack of support causes a rapid price move, allowing the spoofer to profit from the resulting momentum.
Heatmaps make this behavior obvious. On a standard price chart, you would only see a sudden red or green candle. On a heatmap, you see the large order vanish into thin air, providing you with the context needed to avoid being trapped.
A heatmap is not a standalone signal but rather a filter that enhances existing strategies. Whether you are a scalper, a day trader, or a swing trader, adding market depth visualization can significantly improve your win rate and risk management.
1. Volume Weighted Average Price or VWAP: Using VWAP alongside a heatmap allows you to see if large liquidity blocks are sitting near the average price of the day, which often acts as a magnet for price.
2. Volume Profiles: While a volume profile shows where trades have already happened, the heatmap shows where they might happen next. Comparing the two helps identify high value areas.
3. Candlestick Patterns: A bullish engulfing pattern carries much more weight if it occurs right at a massive block of buy liquidity visible on the heatmap.
Using Bookmap in conjunction with these traditional tools provides a multi dimensional view of the market that few other platforms can match.
Once you are comfortable reading the basic colors and shapes of a heatmap, you can move into advanced order flow analysis. This involves looking at the speed of executions and the behavior of the bid ask spread.
Absorption occurs when price hits a high liquidity zone and stays there. You will see a lot of dots representing executed trades, but the price refuses to move further. This means a large player is absorbing all the market orders. If the liquidity holds, a reversal is likely.
Exhaustion is the opposite. It happens when price moves into a zone and the volume of executed trades suddenly drops off. The market has run out of participants willing to trade at that price, often leading to a quick retracement.
While heatmaps are powerful, they are not a magic wand. New users often fall into traps by misinterpreting the data.
1. Chasing Liquidity: Just because there is a large order at a certain price doesn't mean the market will go there. Liquidity can be a magnet, but it can also be a trap.
2. Overcomplicating the View: It is easy to get overwhelmed by the colors. It is important to keep your focus on the most significant liquidity levels rather than every small flicker of color.
3. Ignoring the Macro Context: A heatmap shows the micro structure of the market. If there is a major economic announcement or a fundamental shift, even the largest liquidity block can be steamrolled in seconds.
The transition from traditional technical analysis to visual order flow is a significant step in a trader's career. It requires a shift in mindset from predicting the future to reacting to the present. By spending time observing how price interacts with liquidity, you develop a sense of market rhythm that is impossible to gain from static charts.
Platforms like Bookmap provide the necessary transparency to see the auction process in its purest form. This clarity allows you to trade with more confidence, as you are no longer guessing where support and resistance might be. You are seeing them as they exist in the order book.
Success in trading comes down to having an edge, and in today's algorithmic world, that edge is often found in the data that others are ignoring. By mastering the use of heatmaps, you are positioning yourself to understand the true mechanics of price movement. You begin to see the market as a living, breathing entity driven by the constant tension between buyers and sellers. As you refine your ability to read these visual cues, you will find that the noise of the market fades away, leaving behind a clear map of opportunity.